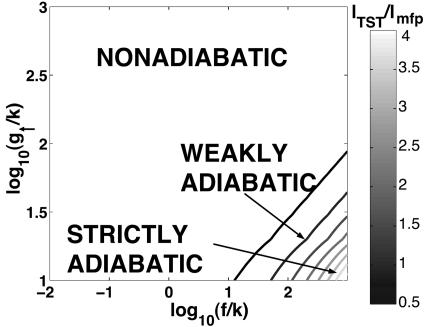
Fig. 3.
A phase diagram as a function of the activated production rate g↑ and the unbinding rate f for constant KeqV2, showing the areas of parameter space where a given escape mechanism dominates based on the ratio of the size of the transition-state region lTST to the mean free path lmfp. If the number of crossings of the separatrix is large, lTST/lmfp > 1, the transition is adiabatic. If the system commits to a new attractor after one crossing, lTST/lmfp < 1, the transition is nonadiabatic.

