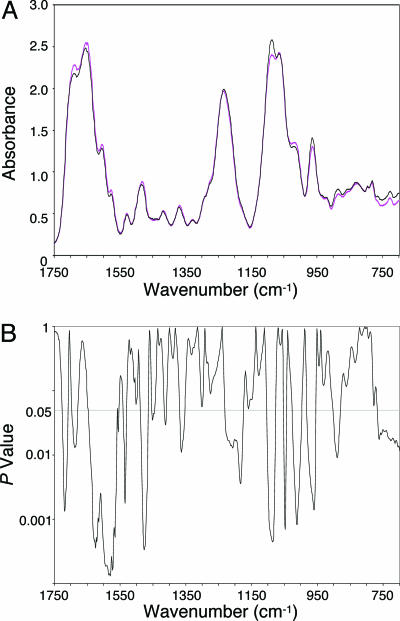
Fig. 1.
Significant differences in the base and backbone structures exist between the DNA of the younger men and that of the older men with the cancer DNA phenotype. (A) Comparison of FT-IR spectra of the DNA of younger men (black line; n = 9) and the cancer DNA phenotype in the older men (magenta line; n = 5). (B) Corresponding P values.

