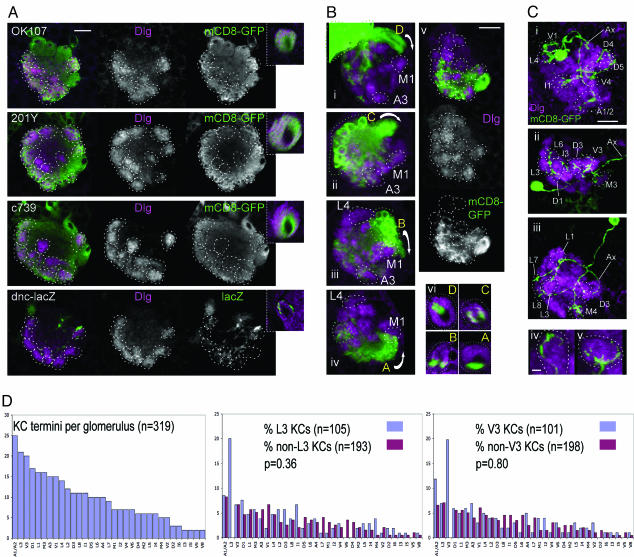
Fig. 3.
Nonstereotypic innervation of calyx glomeruli by KCs. (A) KC subsets defined by gene expression project to glomeruli throughout the calyx. Each row shows a horizontal confocal section through a calyx stained for Dlg, and GAL4 insertion OK107, 201Y, or c739 driving expression of mCD8-GFP or dnc-lacZ; a cross-section through the pedunculus of each MB is shown in the right insets. Each subset of KCs appears to project to most or all glomeruli. Anterior is to the bottom, medial is to the left. Outlines of glomeruli are shown by dashed lines. (Scale bar, 10 μm.) (B) Progeny of individual mushroom body neuroblasts (labeled by mCD8-GFP using MARCM, green) arborize in most glomeruli (anti-Dlg, magenta), but preferentially in regions of the calyx (diffuse green labeling) that correspond to a similar position on the anterior-posterior axis to their respective axon tracts. (i-iv) Confocal reconstructions of calyces in which the neuroblasts giving rise to axon tracts D, C, B, and A, respectively, have been labeled. Rotations of each reconstruction around a longitudinal axis are shown in Movies 3-6, respectively. Arrows show the direction of axon projections from the cell bodies (enclosed in green dotted lines) toward the pedunculus; note that most cell bodies cannot be seen because dorsal sections have been removed before 3D reconstruction to avoid obscuring the calyx. Some glomeruli used as landmarks are labeled. (v) A horizontal section through the middle of a calyx, showing Dlg, and mCD8-GFP in the clonal progeny of a neuroblast that projects into axon tract A. (vi) Cross-sections through the pedunculi of larvae in which neuroblast progenies projecting into the pedunculus via axon tracts D, C, B, and A have been labeled. All preparations are viewed from dorsal; anterior is to the bottom, medial is to the right. (Scale bar, 10 μm.) (C) Projection patterns of individual KCs (expressing mCD8-GFP, green) to calyx glomeruli (anti-Dlg, magenta). (i-iii) Confocal reconstructions of three calyces, each showing the projections of a single KC. Calyx glomeruli where KC claws arborize are identified and outlined with dashed lines; three-dimensional positions of claws can be seen in rotations of these reconstructions in Movies 7-9, respectively. (iv and v) Confocal reconstructions showing the relationship of two different claws to two individual glomeruli. Rotations of reconstructions are shown in Movies 10 and 11, respectively. All panels are viewed from dorsal, with anterior to the bottom and medial to the right. Ax, KC axon, which projects to the pedunculus. (Scale bars, 10 μm in i-iii and 2 μm in iv and v.) (D) (Left) Numbers of claws from 55 labeled single KCs that innervate each calyx glomerulus. A1 and A2 were combined because they could only be distinguished reliably by using NP225 or GH146 GAL4 lines as markers (Fig. 5). (Center) For glomerulus L3, the frequencies (y axis) with which other glomeruli (x axis) are innervated either by KCs that also innervate L3 (left blue bars), or by KCs that do not innervate L3 (right red bars), are compared. Frequencies are expressed as a percentage of all claws in the respective category, excluding claws in L3. The total number of claws in each category is shown, together with the P value from a χ2 comparison of the two distributions. (Right) A similar analysis for glomerulus V3. Original data on claw distributions are supplied in Table 2.

