Fig. 2.
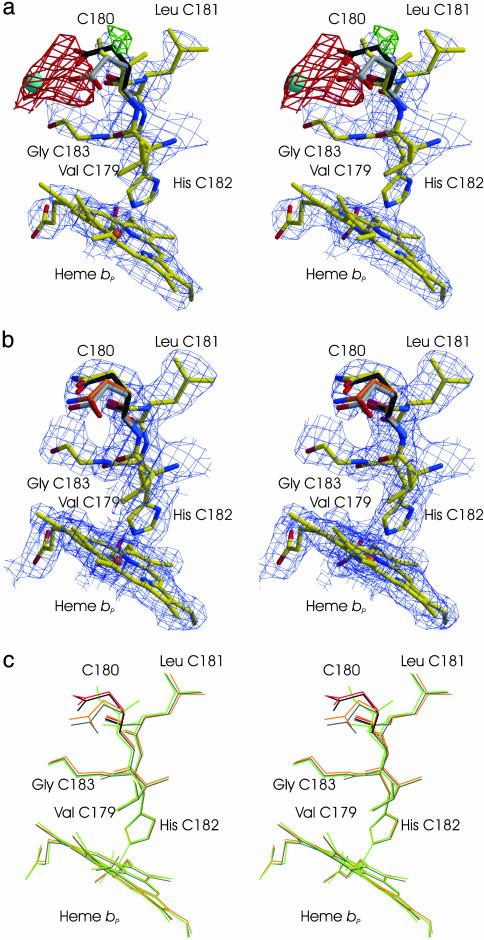
Stereoviews of the crystal structures of Glu-C180 → Ile and Glu-C180→Gln QFR. (a and b) Representative sections of the 2|Fo| – |Fc| composite-omit (43) electron density maps, contoured at 1.0 standard deviations (σ) above the mean density of the map for the Glu-C180 → Ile (a) and Glu-C180 → Gln (b) variant enzymes. Shown are the proximal heme group, bP, in subunit C, as well as the residues between Val-C179 and Gly-C183. Also displayed are the |Fvar| – |Fwt| difference electron density maps contoured at 3σ (in green) and –3σ (in red). (a) The structure shown is that of Glu-C180 → Ile QFR with carbon atoms in yellow, nitrogen atoms in blue, oxygen atoms in red, and the heme iron in orange. Superimposed from the structure of wild-type QFR (PDB ID code 2BS2) are the two Glu-C180 side chain conformers (with carbon atoms in black and gray, respectively) and the oxygen atom of an adjacent water molecule (in light blue). (b) The structure shown is that of Glu-C180 → Gln QFR with atomic color coding for a. The second Gln-C180 side-chain conformer is shown with carbon atoms colored in orange. (c) Superposition for the region displayed in a and b of the structures of wild-type QFR (black, PDB ID code 2BS2, with the second Glu-C180 displayed in gray), Glu-C180 → Gln QFR (orange, with the second Gln-C180 conformer displayed in red) and Glu-C180 → Ile (green).

