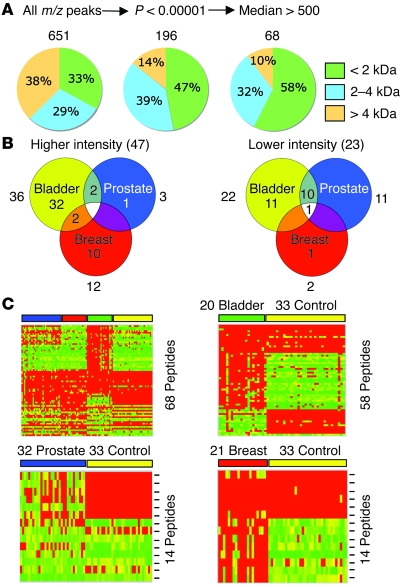
Figure 2. Feature selection and comparative analysis of serum peptide profiling data derived from 3 groups of cancer patients and healthy controls.
(A) The peak list was subjected to a Mann-Whitney U test for each individual cancer versus the control. Only peaks with adjusted P values of less than 0.00001 were passed through a second filter (median peak intensity > 500 units); a peak was selected if it passed the threshold in 1 cancer or in the control. (B) Venn diagrams show the number of peptides that passed both feature selection steps. The numbers shown outside the diagrams indicate the total number of peptides of a specific cancer group that were either up (Higher intensity) or down (Lower intensity). (C) Heat maps compare the selected features of the 3 cancer groups with controls in multiclass and binary formats. Columns represent samples (per group); rows are m/z peaks (not in numerical order). Peptides used in each binary comparison are the sum of those specifically higher and lower in each cancer group; the multiclass heat map contains the combined, nonredundant number of peptides. The multiclass, bladder, and breast heat map scales of normalized intensities range from 0 (green) to 500 (red) with the midpoint at 250 (yellow); those of the prostate map are from 0 (green) to 2,000 (red), with the midpoint at 1,000 (yellow).

