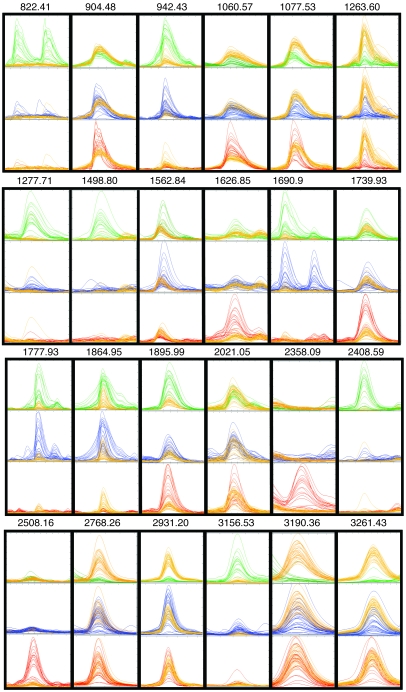
Figure 3. MALDI-TOF mass spectral overlays of selected peaks derived from serum peptide profiling of 3 groups of cancer patients and healthy controls.
Spectra were obtained, aligned, and normalized as described in Methods and were displayed using the mass spectra viewer. Peptide ions have been selected to illustrate group-specific differences in normalized intensities, except for 2021.05, which is provided here as an example of the vast majority of peptide ions with intensities that were not statistically different between any 2 groups. The 24 overlays (not to scale) each show a binary comparison for all spectra from either the bladder cancer (n = 20; green), prostate cancer (n = 32; blue), or breast cancer patient group (n = 21; red) versus the control group (n = 33; yellow). They are arrayed so that an identical mass range window is shown for each of the 3 binary comparisons in which spectral intensities have been normalized and scaled to the same size. The monoisotopic mass (m/z) is shown for each peptide ion peak.

