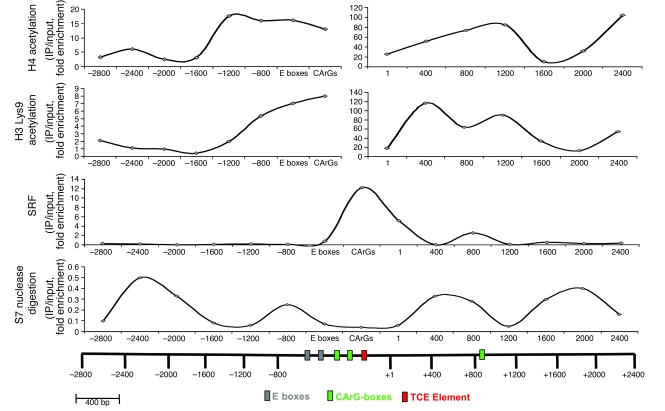
Figure 2. Characterization of transcription factor and histone modification distribution across the α-SMA promoter-enhancer locus.
Fifteen pairs of PCR primers spaced at 400-bp intervals were used in ChIP assays to map the distribution of factors plotted. Nuclease accessibility was determined as in Figure 1. E boxes are cis-elements 5′ to CArG boxes. Data are representative of 2 independent experiments.

