Figure 5.
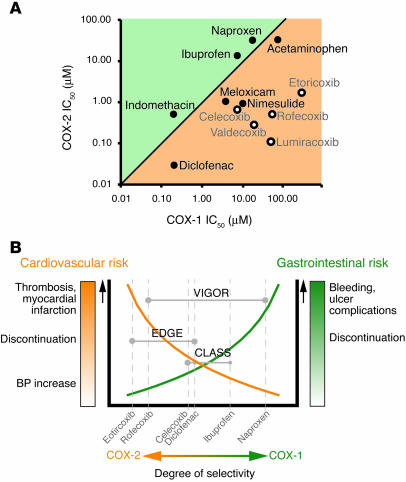
The spectrum of selectivity for COX inhibition. (A) The relative affinities of tNSAIDs and coxibs (open circles) for COX-1 and COX-2. The concentrations required to inhibit COX-1 and COX-2 by 50% (IC50) have been measured using whole-blood assays of COX-1 and COX-2 activity in vitro. The diagonal line indicates equivalent COX-1 and COX-2 inhibition. Drugs plotted below the line (orange) are more potent inhibitors of COX-2 than drugs plotted above the line (green). The distance to the line is a measure of selectivity. Note the log scale. For example, lumiracoxib is the compound with the highest degree of selectivity for COX-2 as its distance to the line is the largest. Celecoxib and diclofenac have similar degrees of selectivity for COX-2, as their distances to the line are similar; however, diclofenac is active at lower concentrations and thus located more to the left. Figure modified with permission from The New England Journal of Medicine (28). (B) Implication of the relative degrees of selectivity. Increasing degrees of selectivity for COX-2 are associated with augmented cardiovascular risk while increasing degrees of selectivity for COX-1 are associated with augmented GI risk. The relative size of the circles indicates approximately the variation in sample sizes among the trials.

