
Figure 4.
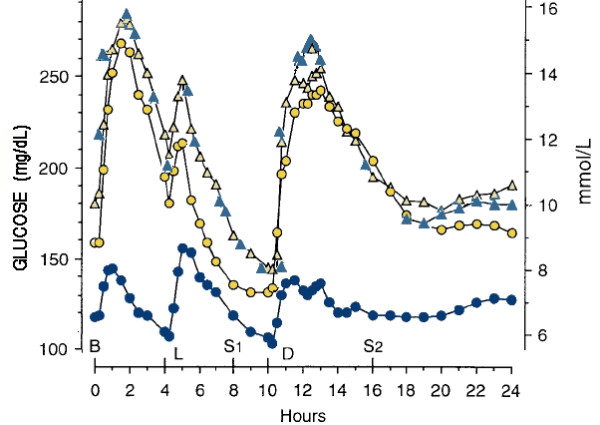
Effect of diet on plasma glucose. Mean plasma glucose concentration before (triangles) and after 5 weeks on control diet (yellow circles: (CHO:fat:protein = 55:30:15)) or 5 weeks on lower carbohydrate diet (blue circles: (20:50:30)). Meal points are Breakfast (B), lunch (L) and dinner(D) plus 2 snacks (S1, S2). Data from reference [57].