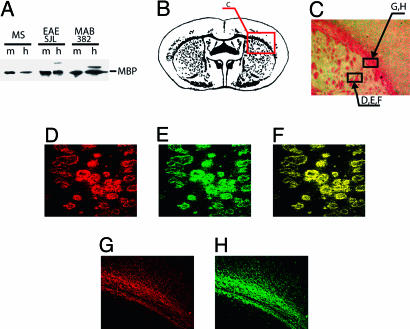
Fig. 1.
IgGs of MS patient and EAE mice react with MBP in rat brain sections. (A) Western blotting of purified MBP (m) and rat brain tissue homogenate (h) with antigen affinity-purified IgG from a MS patient, a EAE SJL mouse, and with MAB382. (B) Schematic myelin distribution in a rat brain section. (C) Wright's stain of the rat brain section chosen for analysis. D-H were taken from the indicated areas. (D-F) Double-label immunofluorescence of mouse anti-MBP monoclonal antibody MAB382 and catalytic IgG from MS patient. (D) MAB382 (Alexa 546, red). (E) MS (FITC, green). (F) Merge of D and E.(G and H) Immunofluorescence of MAB382 and IgG from EAE SJL mouse on serial sections. (G) MAB382 (Alexa 546, red). (H) IgG from EAE mouse (Alexa 488, green).

