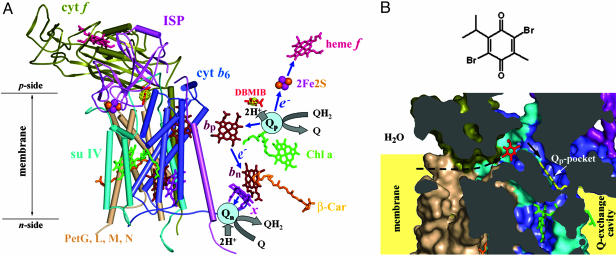
Fig. 1.
Structure model of the cytochrome b6f complex with bound DBMIB. (A) Model (3.8 Å) of the dimeric b6f complex from M. laminosus with bound DBMIB. To emphasize the prosthetic groups and electron transfer pathways, (Left) all polypeptide components are shown in one monomer with α-helices viewed as cylinders, whereas (Right) only DBMIB and the prosthetic groups are shown in the other monomer. The electron density of DBMIB is shown in yellow with a contour level of 6 σ. The electron transfer pathways (see text for details) in one monomer (Right) are shown schematically. 2Fe2S, iron-sulfur cluster; blue arrows, electron transfer paths; bp, heme bp; bn, heme bn; β-Car, β-carotene; Chl a, chlorophyll a; e–, electron; H+, proton; Q, quinone; QH2, quinol; Qn, n-side quinone binding site (reduction site); Qp, p-side quinone binding site (oxidation site); x, heme x. For clarity, endogenous PQ molecules bound at the Qn site are not shown. (B)(Upper) Chemical structure of DBMIB and (Lower) cross-sectional view of its binding site and position relative to the Qp pocket. To show the position of the Qp pocket, a ring-in TDS molecule (yellow) from the C. reinhardtii structure is superimposed on the structure. The black arrows indicate the putative pathway for the entry of DBMIB to the Qp pocket from the membrane lipid phase. Color code is the same as in A. All protein structural figures were drawn with pymol (http://pymol.sourceforge.net).

