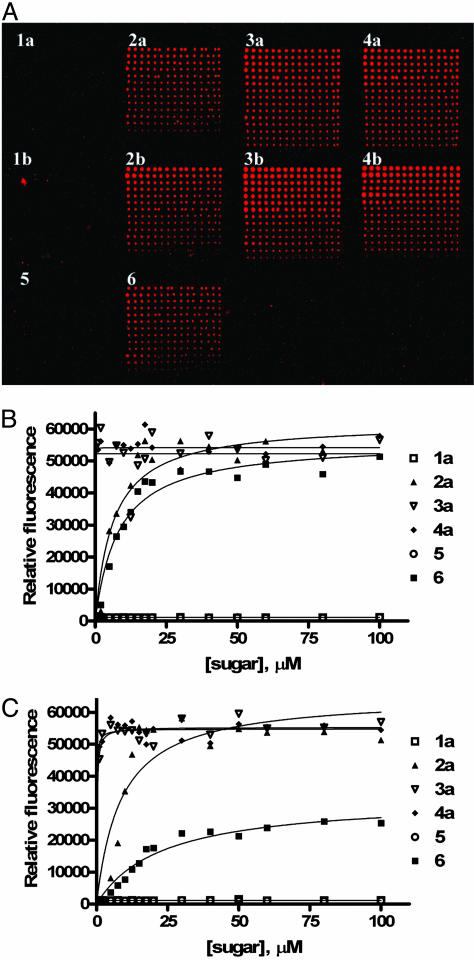
Fig. 5.
Binding of monoclonal antibodies to Globo H and truncated sequences. (A) Slide image obtained from fluorescence scan after antibody incubation assay with VK-9. The grids contain sugars 1–4a printed in the top row from left to right, 1–4b in the middle row, and 5–6 in the bottom row. Each grid has decreasing concentrations of the glycan from 100 to 1 μM from top to bottom with each row containing 15 replicates. (B and C) Carbohydrate-antibody binding curves for Globo H analogs 1–4a, 5, and 6 with MBr1 (B) and VK-9 (C).

