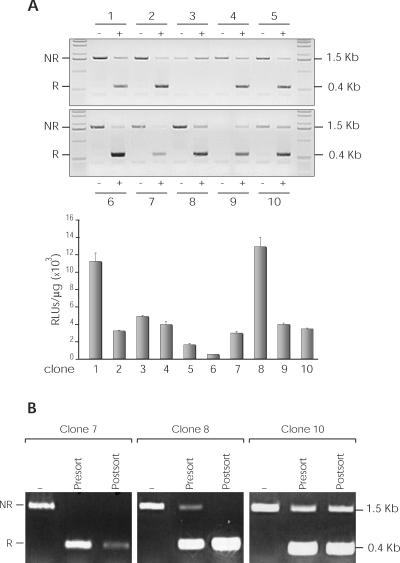
Figure 3.
Analysis of recombination in psps-Luc-transduced NIH-3T3 clones. Ten clones (1–10) were isolated and SSR analyzed by PCR and luciferase expression. (A) Genomic DNA of each clone (−, untransduced cells; +, transduced cells) was amplified using specific primers of the EF-1α promoter and luciferase gene (see Figure 2A). Non-recombined DNA (NR; 1.5 kb band), recombined DNA (R; 0.4 kb band) (upper panel). The recombination level was determined by luciferase activity quantification (lower panel). (B) EGFP-positive subpopulations were purified by cell sorting of three different clones (7, 8 and 10). Recombination level in untransduced (−) and transduced (pre-sorting and post-sorting) cells was analyzed by PCR.

