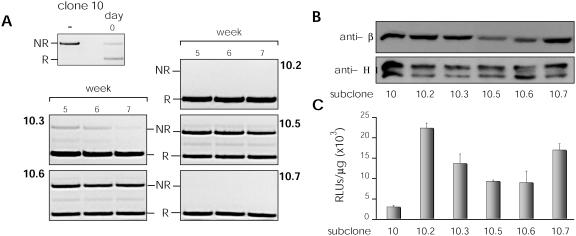
Figure 4.
Analysis of recombination time-course. Several C10 subclones were obtained and their recombination rates analyzed over a 7-week period. The recombination rate obtained for five of them (10.2, 10.3, 10.5, 10.6 and 10.7) was analyzed by several techniques. (A) Non-recombined (NR) and recombined (R) DNA fragments amplified by PCR. (B) Detection of β recombinase expression and histone H1, as control, by western blot. (C) Luciferase activity. Western blot and luciferase activity were measured in the fifth week.

