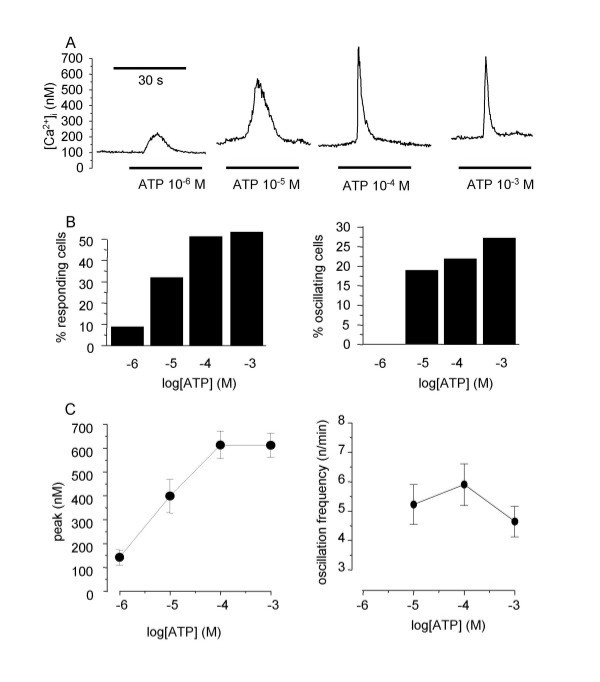
Figure 3.
Effect of ATP on freshly isolated rat tracheal myocytes. A: original traces of the effect of several ATP concentrations (10-6 to M 10-3 M) on freshly isolated rat tracheal myocytes (n = 33 to 97 for each concentration). B: percentage of responding cells depending on ATP concentration (left panel) and percentage of oscillating responses in responding cells. C: abscissa: log concentration of ATP (M). Ordinates: amplitude of the Ca2+ peak (left panel) in responding cells (left panel) and oscillation frequency in oscillating cells.

