
Figure 2.
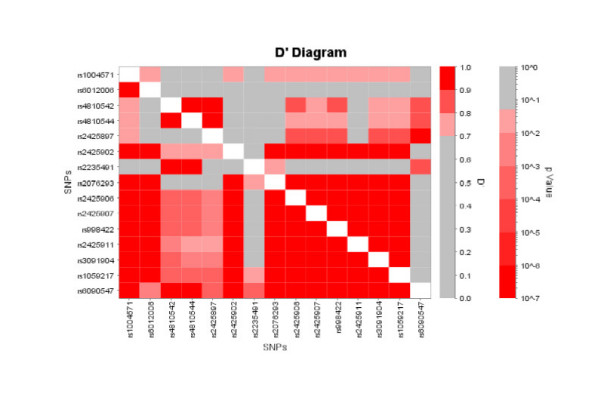
Marker-to-marker D' plot for the SLC2A10 SNPs. Inter-SNP D' values are graphically represented using LD Viewer which generates a color coded plot of the pair-wise statistics in the upper portion of the matrix, and a color coded plot of the calculated P-value for each LD measurement in the bottom portion of the matrix.