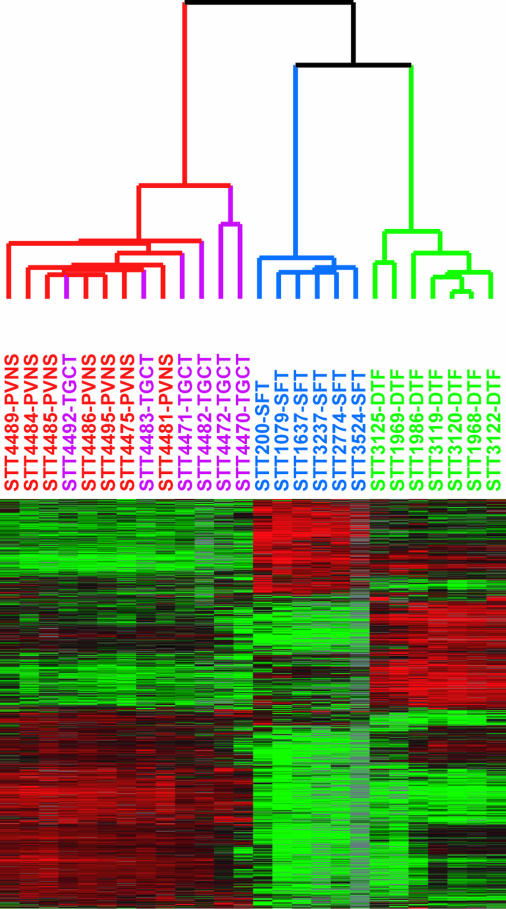
Fig. 4.
Unsupervised hierarchical clustering of seven cases of PVNS (in red), six cases of TGCT (purple), six cases of SFT (blue), and seven cases of DTF (green) based on expression profiling with DNA microarrays. In the heatmap, red represents high expression, black represents median expression, green represents low expression, and gray represents no data.

