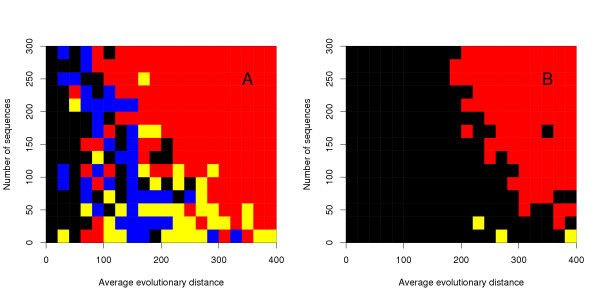
Figure 3.
A 2D plot indicating in which situations different methods perform better on the large testset. The accuracy of the most accurate versions of Kalign, Muscle, and Mafft was measured for each combination of average evolutionary distance (in PAM units) and number of sequences. The cells were colored according to the most accurate program as: Kalign:red; Muscle:blue; Mafft:yellow. If there was a tie between two or more methods the cell is black. In (a) it is enough to win by the smallest margin, whereas in (b) the program must win by a margin of 2%. Up to 200 PAM no program stands out as a clear winner while above this distance Kalign dominates.

