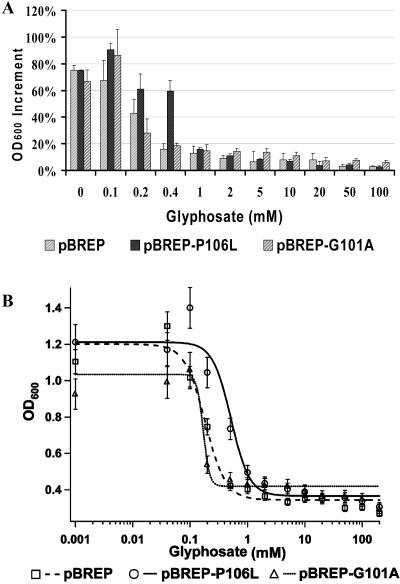
Figure 1.
Glyphosate resistance analysis of EPSPS mutants via growth of E. coli transformant. DH5α was transformed with pBREP (wild type), pBREP-P106L, and pBREP-G101A. The transformants were cultured in liquid MOPS medium containing glyphosate in increased concentration gradients. Aliquots of culture sample were measured for OD600 before (ODb) and after (ODa) 12 h of incubation in 37°C by vigorous vibration. Error bars represent the sd resulting from three repetitions. A, Bar chart; OD600 increment was calculated as (ODa − ODb)/OD0, in which OD0 is the final value of OD600 absent glyphosate. B, Curve chart; the curve was determined by fitting data of ODb to f(x) = C + (D − C)/(1 + (x/LD50)b) (Seefeldt et al., 1995; Igor Pro 4.00), where C = lower limit, D = upper limit, LD50 = 50% lethal dose, and b = slope of the curve at LD50. The first and last points on the curve represent the data of OD0 and ODb.

