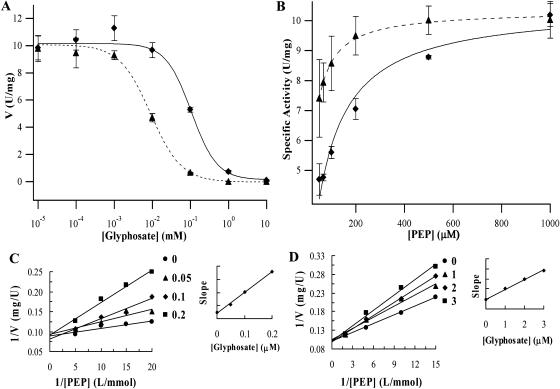
Figure 2.
Enzyme assay results. Km (PEP) and IC50 were obtained from the least-squares fitting of the data to appropriate equations (Igor Pro 4.00). Black triangles and diamonds represent the measured data points of wild-type OsEPSPS and P106L EPSPS, respectively. Error bars represent the sd resulting from three repetitions. Dashed and solid curves represent the fitting curves of OsEPSPS and P106L mutant, respectively. S3P concentration was fixed at 1 mm. A, Km (PEP) was determined by fitting the data to V = Vmax[S]/(Km + [S]), where V is the velocity of the reaction (expressed in U/mg), Vmax is the maximum velocity, and [S] is the concentration of the substrate assayed for the Km. B, The curve was determined by fitting data to V = Vmin + (Vmax − Vmin)/(1 + ([I]/IC50)s), where [I] is concentration of glyphosate and s is the slope of the curve at the IC50. The first point on the curve represents the data obtained with no glyphosate. Ki value was determined by the method as described (Copeland, 1996). C, Ki (glyphosate) of OsEPSPS was determined by fixed PEP concentration of 0.05, 0.067, 0.1, and 0.2 mm, respectively, and glyphosate concentration was 0, 0.05, 0.1, and 0.2 μm. D, Ki (glyphosate) of P106L mutant was determined by fixed PEP concentration of 0.067, 0.1, 0.2, and 0.5 mm, respectively, and glyphosate concentration was 0, 1, 2, and 3 μm.

