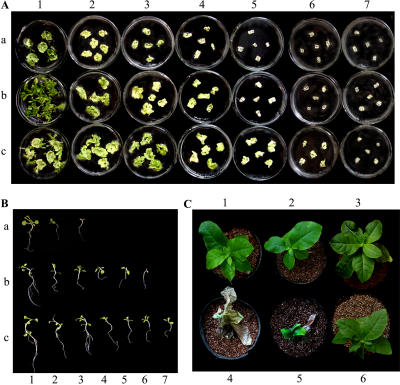
Figure 5.
Glyphosate resistance of transgenic tobacco. A, Photograph was taken after 30 d of culture on medium containing 0 to 0.5 mm glyphosate. (Columns 1–7 contained 0, 0.01, 0.02, 0.05, 0.1, 0.2, and 0.5 mm glyphosate, respectively.) The top line shows the leaf discs of nontransformed plants, the middle line shows the leaf discs transformed with pTi-OsEPSPS, and the bottom line shows the leaf discs of plants transformed with pTi-P106L. B, Photograph was taken at 1 month after the transplant. Seedlings were germinated and selected on medium containing 100 mg/L kanamycin for 7 to 10 d to eliminate the negative plants; the green seedlings with two to four true leaves were transplanted onto medium containing 0 to 10 mm glyphosate. (Columns 1–7 contained 0, 0.05, 0.1, 1, 2, 5, and 10 mm glyphosate, respectively.) The top line shows the seedlings of nontransformed plants, the middle line shows the seedlings of transgenic plant line CEP5 expressing wild-type OsEPSPS, and the bottom line shows the seedlings of plant line P106L-A expressing P106L mutant OsEPSPS. C, Photograph was taken at 2 weeks after the spray treatment. The top line was control plants without treatment of Roundup. The bottom line was sprayed with Roundup at a dose of 0.2 mL/m2 in 1% concentration. Numbers 1 and 4 represent nontransformed plants. Numbers 2 and 5 represent transgenic plant line CEP5 expressing wild-type OsEPSPS. Numbers 3 and 6 represent transgenic plant line P106L-A expressing P106L mutant OsEPSPS.

