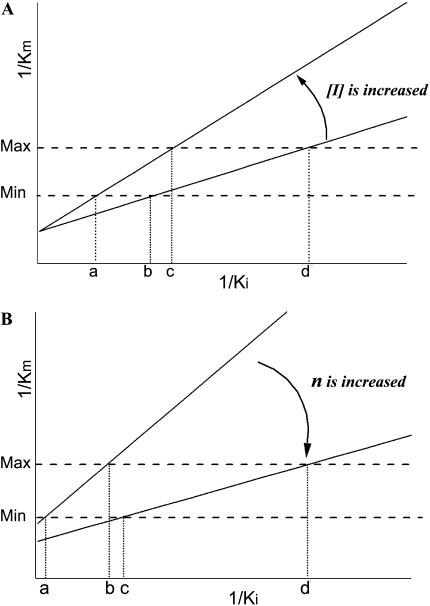
Figure 6.
Schematic diagrams of the relationship between PEP affinity  and glyphosate affinity
  as shown in Equation 4. Two horizontal dash lines represent minimum and maximum values of
  . Four vertical dotted lines represent the corresponding values of
  ; A is obtained when the glyphosate concentration [I] is increased, and B is obtained when the expression level n is increased.

