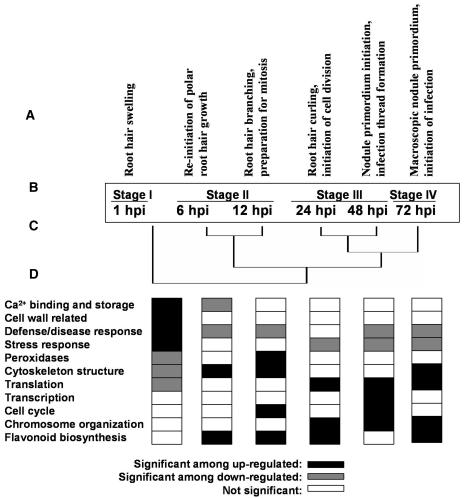
Figure 5.
Expression changes of some gene groups in roots of M. truncatula inoculated with S. meliloti, and accompanying morphological changes from 1 hpi to 72 hpi. A, Root responses observed at different time points in B. C, Clustering of time points based on gene expression changes as presented in Figure 4. D, Representation of some gene groups among up- or down-regulated genes at different time points based on Z scores.

