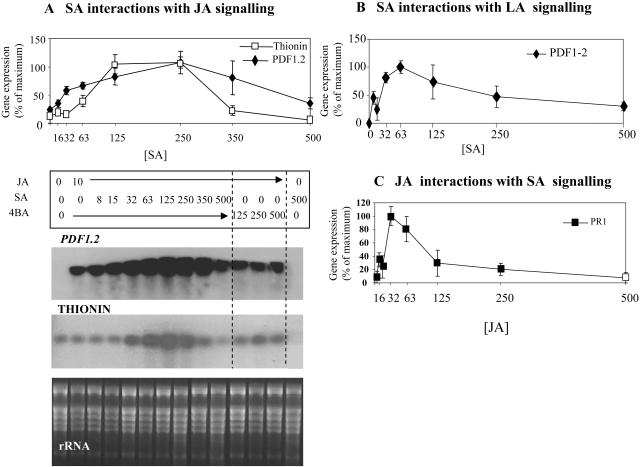
Figure 3.
Effect of SA interactions with JA or LN on PDF1.2, Thi, and PR1 expression in explants of Arabidopsis ecotype Columbia (Col-0). A, PDF1.2 and Thi2.1 transcript accumulation in Arabidopsis Col-0 explants (the central inner 0.5-cm diameter core of a 1-cm disc; see “Materials and Methods”) at 12 h following treatment with 10 μm JA and increasing concentrations of SA (from 8–500 μm) or 4BA (from 125–500 μm), or 500 μm SA alone. The ethidium bromide-stained gel showing ribosomal RNA (rRNA) is presented to demonstrate equal loading. Northern results for two biological replicates for each experiment were scanned by densitometry to obtain numerical values. Values for each replicate were expressed as a percentage of the maximum value within the same replicate. The graph gives the mean percentage for each treatment and the range between replicates. B, Graphical representation of PDF1.2 transcript accumulation in Arabidopsis explants at 12 h following treatment with 10 μm LN and increasing concentrations of SA (from 15–500 μm), or 4BA (from 125–500 μm), or 500 μm SA alone. C, PR1 transcription in Arabidopsis explants at 12 h following treatment with 10 μm SA and increasing concentrations of JA or LN (from 8–500 μm) or only with JA, LN (125–500 μm), or 500 μm SA alone. Graphs B and C were derived as described in A.

