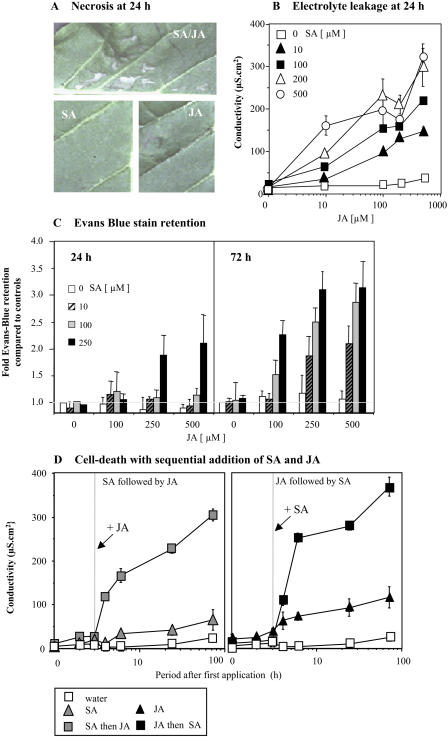
Figure 5.
SA-JA-mediated initiation of plant stress or cell death in tobacco. A, Visible cell death in tobacco leaf panels at 24 h following injection with 0.5 mm SA and 0.5 mm, either alone or in combination. B, Changes in the conductivity (electrolyte leakage) of solutions bathing explants (1-cm diameter cores) of tobacco at 24 h following treatment with various concentrations of JA (0, 10, 100, 200, and 500 μm) with SA (0, 10, 100, 200, and 500 μm). Results are given as mean conductivity change; μS cm2 (n = 6) ± se. C, Retention of Evans blue stain in explants at 24 and 72 h following treatment with 0, 100, 200, and 500 μm JA in combination with 0, 100, 200, or 500 μm SA. Stain retention is expressed as fold increase in mean staining of untreated explants (0 μm SA + JA) at corresponding time points (n = 6) ± se. D, Changes in the conductivity (electrolyte leakage) of solutions bathing explants (1-cm diameter cores) of tobacco in untreated samples, following treatment with 200 μm SA or treatment with 200 μm SA to which 200 μm JA was added after 2 h, as well as the converse scenario where explants were treated with 200 μm JA and 200 μm JA to which 200 μm SA was added at 2 h. Results are given as mean (n = 6) conductivity change, μS cm2 ± se.

