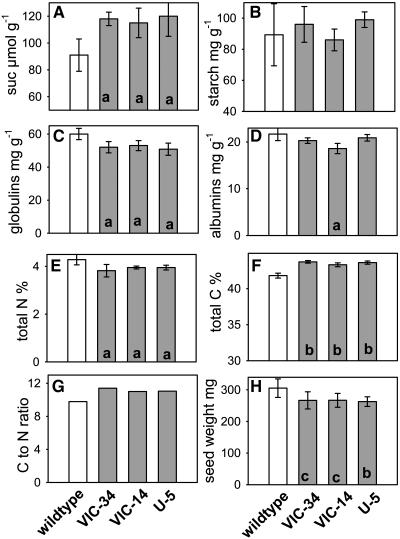
Figure 11.
Characterization of SnRK1 antisense transgenic pea embryos. Embryos from the lines Vic-34, Vic-14, U-5, and the wild type have been analyzed. A, Suc concentration in growing embryos at 21 to 24 DAF. B, Starch content in dry, mature embryos. C, Globulin content in dry, mature embryos. D, Albumin content in dry, mature embryos. E, Percentage of total nitrogen in dry, mature embryos. F, Percentage of total carbon in dry, mature embryos. G, Carbon-to-nitrogen ratio, calculated from E and F. H, Seed weight of dry, mature seeds. The data are presented as means ± sd of four to six individual embryos; n = 50 in H; seeds per line for G, n = 50. Significant differences according to t test: P < 0.05 (a); P < 0.01 (b); and P < 0.001 (c).

