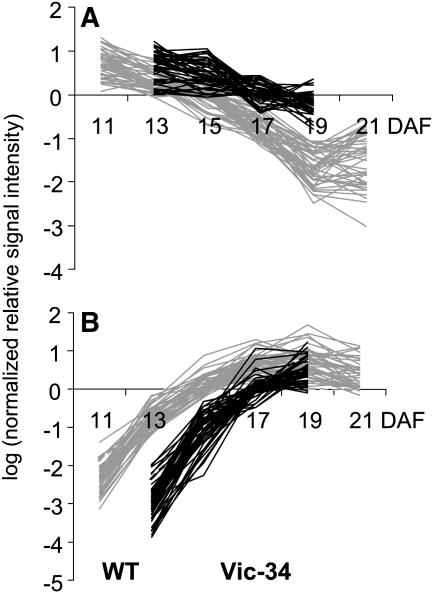
Figure 12.
Clusters of down- and up-regulated genes in SnRK1 antisense and wild-type embryos of pea. Temporal patterns of gene expression have been analyzed using macroarrays in growing wild-type embryos at 11, 13, 15, 17, 19, and 21 DAF (gray lines) and in SnRK1 antisense embryos, line Vic-34, at 13, 15, 17, and 19 DAF (black lines). A, Cluster A represent genes that are delayed down-regulated during the transition phase compared to wild-type seeds. B, Cluster B represents genes that are delayed up-regulated during the transition phase and compared to the wild type. Note logarithmic scale in y axis.

