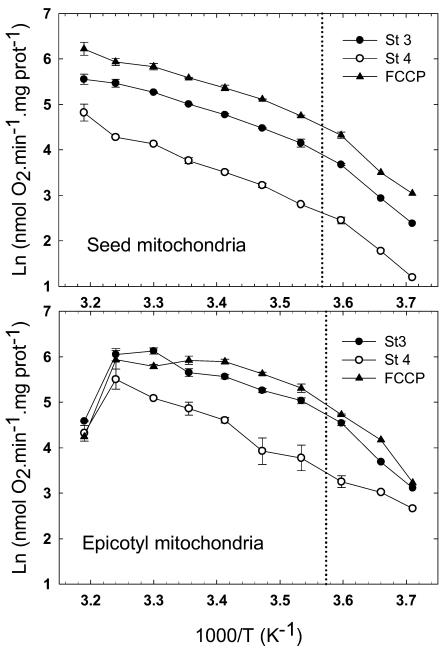
Figure 2.
Effect of temperature on NADH oxidation by pea seed and epicotyl mitochondria. Shown are Arrhenius plots for state 3 (black circles), state 4 (white circles), and uncoupled (black triangles) respiration of pea seed and epicotyl mitochondria within the temperature range of 40°C to −3.5°C with NADH as a substrate. The data correspond to the mean of three repeats with se indicated. The vertical dotted line represents the ABT that was graphically determined using the intersect of linear regressions.

