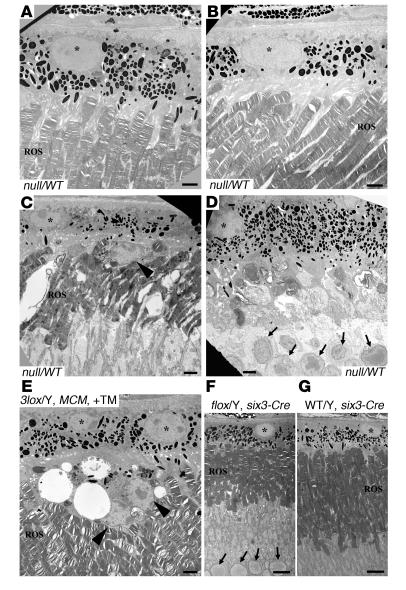
Figure 5.
Electron microscopic analysis of Chm mutant retinas. (A–D) Different sections from the eye of a 9-month-old Chmnull/WT female mouse. (E) A TM-induced Chm3lox/Y MerCreMer mouse. (F) A Chmflox/Y six3-Cre mouse. (G) A ChmWT/Y six3-Cre mouse. RPE nuclei are marked by asterisks. Abnormal cells above the RPE are shown by arrowheads in C and E. Nuclei of cells from the ONL are marked by arrows in D and F. Scale bars: 2 μm (A–E) or 7 μm (F and G).

