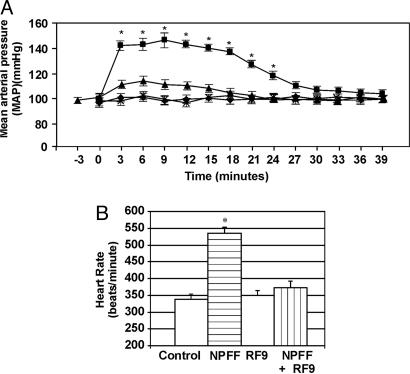
Fig. 3.
RF9 blocks blood pressure effects of NPFF. (A) Changes in MAP [expressed in mmHg (1 mmHg = 133 Pa)] in rats receiving either i.c.v. saline (♦), NPFF (▪), RF9 (×), or NPFF and RF9 applied together (▴). Time 0 indicates the injection point for i.c.v. saline or drug applications. (B) Heart rate changes that accompany MAP alterations in A. Pooled MAP and heart rate data are from five animals. *, significant difference in MAP or heart rate compared with control (P < 0.05).

