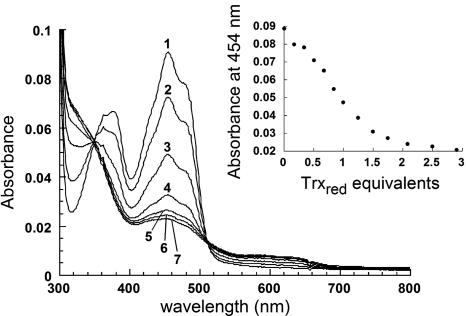
Fig. 3.
Ero1p (7.4 μM in buffer A) was titrated anaerobically with Trxred added from a gas-tight syringe. Inset is a plot of absorbance at 454 nm recorded after each addition. Selected spectra from the titration (curves 1-7, corresponding to 0.0, 0.5, 1.0, 1.5, 2.1, 2.5, and 2.9 eq of Trxred per mol of flavin) are plotted in the main panel.

