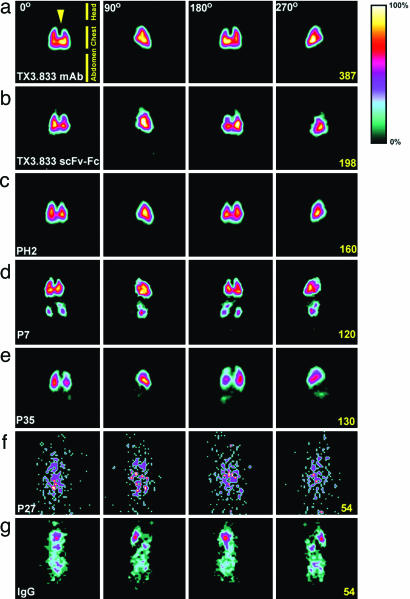
Fig. 5.
In vivo planar γ-scintigraphic imaging of scFv-Fcs in rat. (a-g) Planar images were collected by using a single-photon-emission computed tomography imaging system after tail-vein injection of the indicated 125I-scFv-Fcs. Degrees of rotation of the animal along the body axis are indicated on top; scale values are indicated on the right side of each row. Frames were collected 1 h (a-c, f, and g) or 2 h (d and e) after injection. The arrow (Upper Left) indicates the position of the heart cavity.

