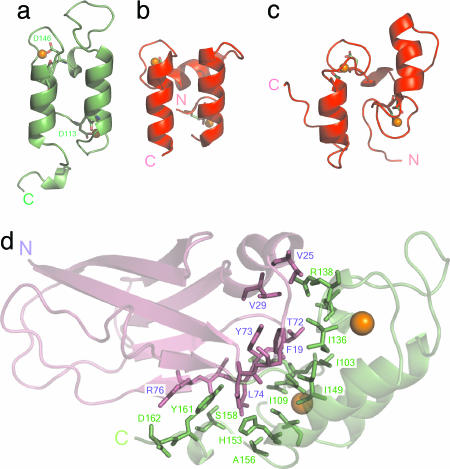
Fig. 2.
Doc conformations and XDoc interface. The structures of type II Doc from the type II Coh-XDoc complex (a); type I Doc from the type I Coh-Doc complex (21) (b); and isolated type I Doc (15) (c) illustrate the differences in loop conformations. Coordinating residues at position 1 and 12 of each Ca2+-binding loop as stick models, with the Asp at position 12 in each loop of the type II-Doc structure labeled with one-letter code and the corresponding residue number. (d) The XDoc illustration shows the module-module contacts. Interface residues from the X module and type II Doc are depicted as magenta and green stick models, respectively, on the backbone ribbon representation of the XDoc structure.

