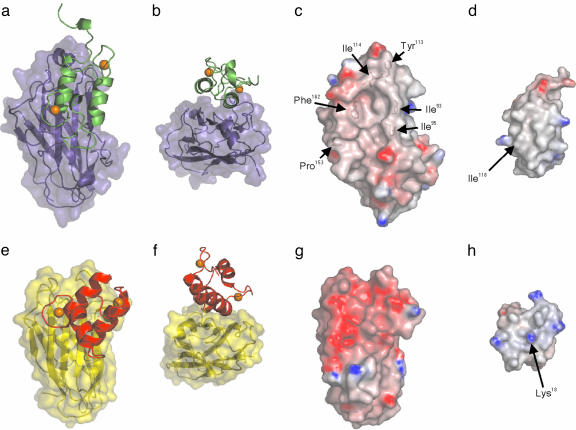
Fig. 4.
Interaction surfaces of type I- and type II Coh-Doc complexes. Ribbon representations of type II Doc (green) (a) on the molecular surface of the type II Coh (blue) and type I Doc (red) (e) on the molecular surface of type I Coh (yellow) (21). Representations in b and f have been rotated clockwise 90° around the x axis, followed by a 180° clockwise rotation around the z axis. Electrostatic surface potential representations of C. thermocellum type II Coh (c), C. thermocellum type II Doc (d), C. thermocellum type I Coh (21) (g), and C. thermocellum type I Doc (21) (h). Positive regions are shown in blue and negative regions in red. Residues contributing to the hydrophobic surface character of C. thermocellum type II Coh are labeled accordingly. The location of Ile-118 on the surface of the type II Doc and the analogous residue in the type I Doc (Lys-18) are identified. The electrostatic surface potentials were calculated in grasp (47) and are contoured from -14 (red) to +14 (blue). Ca2+ ions are shown as orange spheres.

