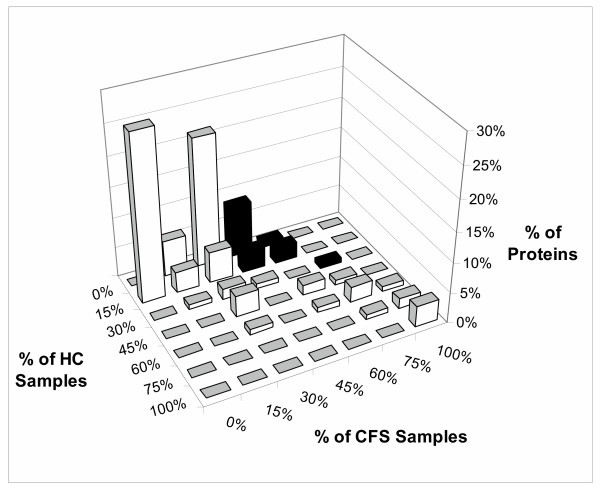
Figure 6.
Distributions of proteins in healthy control (HC) and CFS samples. The frequency of detection for each protein was determined for the HC (left axis) and CFS (right axis) groups. These axes were divided into "bins" of 0% (absent), 1 to 15%, 16 to 30%, 31 to 45%, 46 to 60%, 61 to 75%, and 76 to 100%. The vertical axis was the percentage of all proteins detected within each intersection of the CFS vs. HC matrix. Most of the proteins were detected in less than 30% of each group. Proteins detected in both groups with roughly equal frequencies of detection were near the line of identity (white bars). The grid region corresponding to the CFS – associated proteome was highlighted by black bars.

