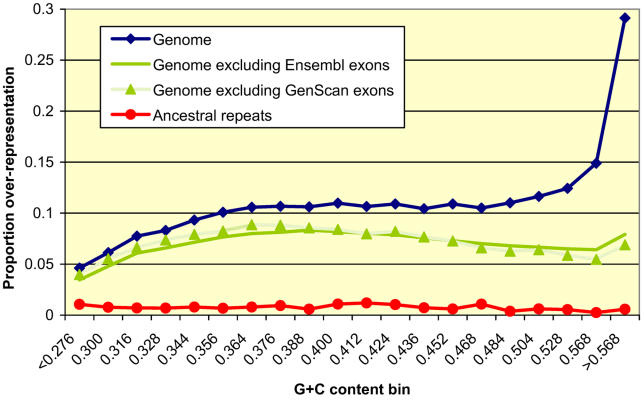
Figure 4. Extent of Indel-Purifying Selection in the Human Genome by G+C Content.
Vertical axis shows σ (fraction of nucleotides in ungapped segments that are overrepresented with respect to predictions of the neutral indel model) in human–mouse alignments, for the whole genome (blue), whole genome without exons (green, Ensembl exons including UTRs; shaded green, GenScan exons), both relative to 1,002-Mb mouse-aligning bases, and overrepresentation relative to 177 Mb of ARs (red). In all cases, overrepresentation on the X chromosome was measured separately; values shown are for all chromosomes combined. The measured overrepresentation of long ungapped segments is mainly due to indel-purifying selection, and in part to neutral indel rate variation and other causes (see the section Accounting for Indel Rate Variation). The exclusion of annotated exons, which tend to reside in G+C–rich regions of the genome, all but removed the peak at the highest G+C quantiles, indicating that non-genic functional material tends to accumulate at intermediate G+C levels.

