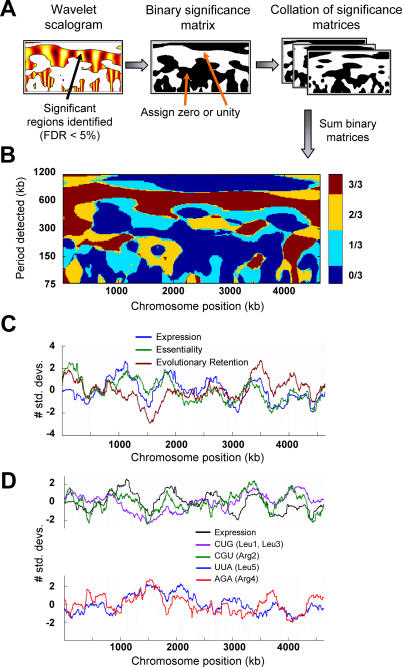
Figure 4. Correlation of Specific Chromosome Position-Dependent Patterns in E. coli Functional Properties.
(A) Wavelet scalograms calculated for gene expression, gene essentiality, and evolutionary retention index were converted to a binary significance matrix by setting each significant point in a scalogram (FDR < 5%) to unity and each non-significant point to zero.
(B) These binary matrices were summed across the three properties listed above to determine chromosome position-dependent patterns that were consistent across the different properties, and the resulting map was color-coded according to how many of the properties shared significant patterns. The red-colored segments indicate the periods and chromosome positions at which all three properties exhibited significant patterns. The averaged data have been normalized such that the mean is zero and the tick marks indicate SDs from the mean value.
(C) Correlation of gene expression, essentiality, and evolutionary retention averaged at a window of 325 kb (650-kb period).
(D) Correlation of gene expression with intragenic codon preferences for two of the major codons encoding leucine (CUG) and arginine (CGU), and anti-correlation of these with preferences for the corresponding minor codons, UUA and AGA, at a moving average of 325 kb. The labels are as described above in (C).

