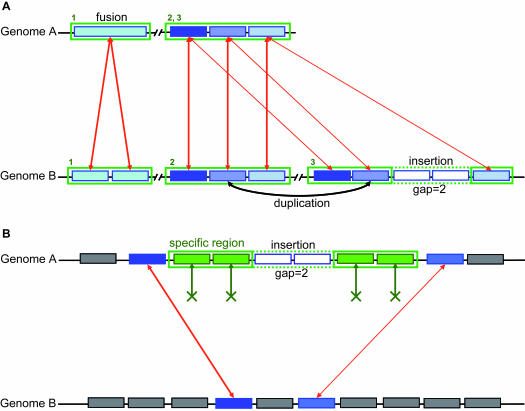
Figure 1.
Synteny group and specific region detection. (A) Example of synteny groups (rectangles with green borders) between two genomes A and B. Syntonizer software allows multiple correspondences between genes (red arrows, e.g. blastP similarity results) to detect duplications and gene fusion/fission events. Local rearrangements (inversion; insertion/deletion) are allowed in our method. The gap parameter defines the number of consecutive genes not involved in synteny. The first synteny group shows a gene fusion event in genome A. The second synteny group shows a perfect gene order conservation in the two compared genomes. The third one is the result of a duplication in genome B together with the insertion of two genes (the gap parameter is then equal to 2). (B) Example of a specific region (rectangle with green border) in the genome A. Co-localized genes (plain green rectangles in genome A) have no ortholog in the compared genome B. Lack of correspondence relations (green arrows) are explicitly represented. A gap parameter represents the maximum number of consecutive genes with homologies in the compared genome. In this example, two genes are inserted (the gap parameter is then equal to 2).

