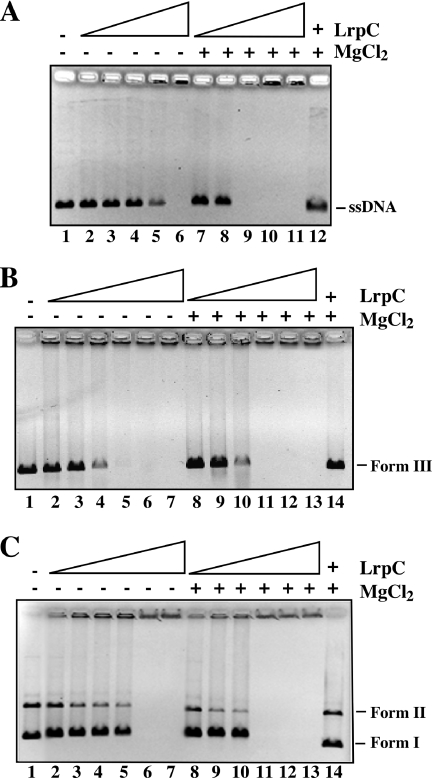
Figure 1.
Effect of Mg2+ in the binding of LrpC to DNA. The binding of increasing concentrations of LrpC to 10 nM pGEM-3Zf(+) circular ssDNA (A), pGEM-3Zf(+) EcoRI-linearized dsDNA (B) and pGEM-3Zf(+) supercoiled dsDNA (C) was assayed in the presence of 5 mM EDTA or 5 mM MgC12 by agarose gel electrophoresis followed by ethidium bromide staining. LrpC concentrations are 50, 100, 150, 200 and 400 nM in (A); 100, 200, 400, 500, 600 and 700 nM in (B); 200, 400, 500, 600, 700 and 800 nM in (C). In the last lane of all the parts, the maximal LrpC concentration was incubated with DNA followed by addition of 1% SDS.

