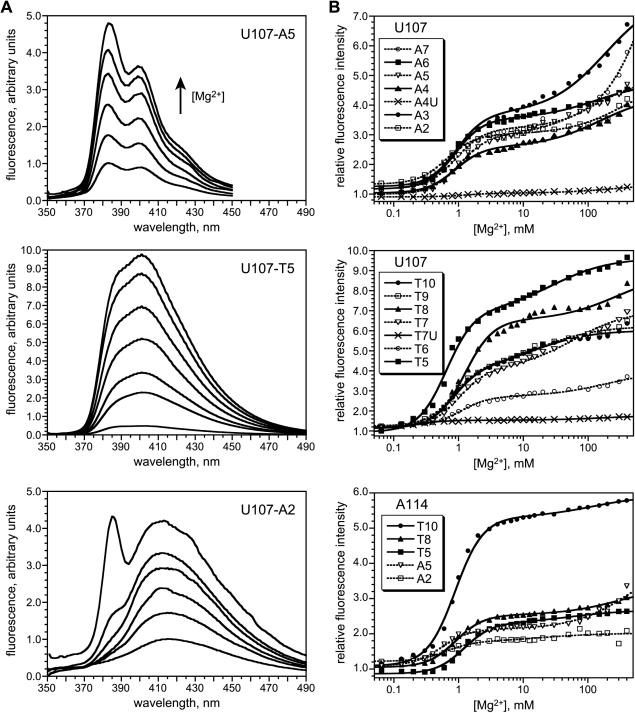
Figure 4.
Equilibrium fluorescence titrations of P4–P6 derivatives labeled with pyrene at U107 and A114. (A) Fluorescence emission spectra (λexc = 340 nm) showing representative data from 0 to 400 Mg2+ (1× TB buffer, 35°C). The U107 A3–A7 and T6–T10 spectra were similar in shape to A5 (data not shown). The low-wavelength spectral feature for U107-A2 was observed with varying intensity at all other tested nucleotide positions (see Supplementary Data). For each of the five A114 tethers, the fluorescence spectra were qualitatively similar to those for U107 with the same tether (see Supplementary Data). (B) Fitted titration curves for the A and T series of tethers at U107 and A114. The relative fluorescence intensity was determined at λmax in all cases. See Materials and Methods for details of curve fitting. See Supplementary Data for [Mg2+]1/2 values.

