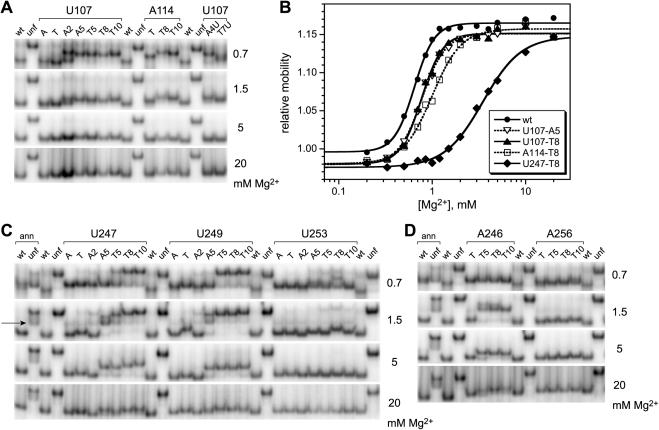
Figure 8.
Nondenaturing (native) polyacrylamide gel electrophoresis of pyrene-labeled P4–P6 RNAs. The Mg2+ concentration used throughout each gel is shown on the right side of each image. Wt and unf denote unmodified wild-type P4–P6 and the unfolded control mutant (30). (A) Representative data for U107 and A114 derivatives. The lane labels A and T denote P4–P6 derivatives with 2′-amino or 2′-tethered amino groups but lacking pyrene. (B) Representative equilibrium titration curves derived from the gel data. From these curves, the energetic consequences of pyrene derivatization may be computed (28). The ΔΔG°′ values ranged from ∼0.4 kcal/mol (U107-A5 and T8) to ∼3–4 kcal/mol (U247-T8). For additional titration curves and ΔΔG°′ values, see Supplementary Data. (C) Data for U247, U249 and U253 derivatives. The wt and unf samples additionally labeled ‘ann’ were prepared by annealing the 24-mer RNA oligonucleotide to the 136-nt remainder of P4–P6 as in Figure 3C. The arrow on the left indicates the band corresponding to the unannealed 136-nt RNA that is particularly prominent at low Mg2+ concentrations (see Materials and Methods). (D) Data for A246 and A256 derivatives.

