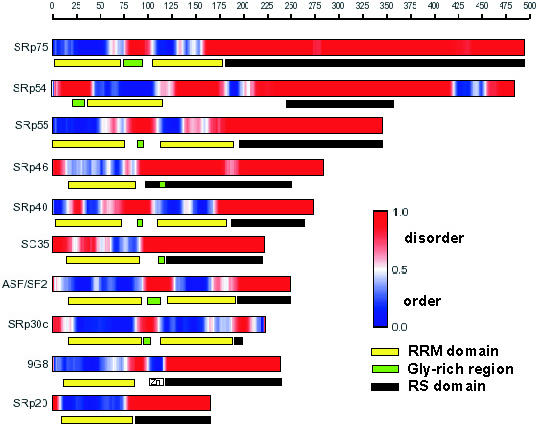
Figure 4.

Domain organization and disorder predictions for SR proteins. The upper bar for each protein represents PONDR® VL-XT predictions with the red color signifying disorder and the blue color signifying order (see the gradient representation of the disorder scores shown on the vertical bar of the legend). The lower bar represents the location of the domains: RRM domain in yellow, Gly-rich region in green and RS domain in black. The Zn knuckle of the 9G8 protein is marked ‘Zn’. The RS domain boundaries correspond to the SWISS-PROT (42) database annotations.
