Figure 6.

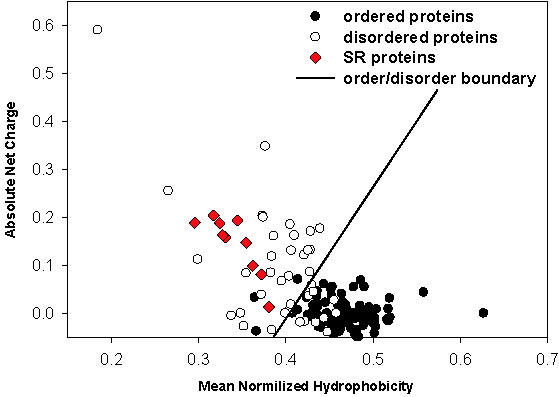
Charge-hydropathy analysis of SR proteins. The ordered proteins are represented as solid circles, the disordered proteins as open circles and the SR proteins as red diamonds. The order-disorder boundary is shown as a solid line.

Charge-hydropathy analysis of SR proteins. The ordered proteins are represented as solid circles, the disordered proteins as open circles and the SR proteins as red diamonds. The order-disorder boundary is shown as a solid line.