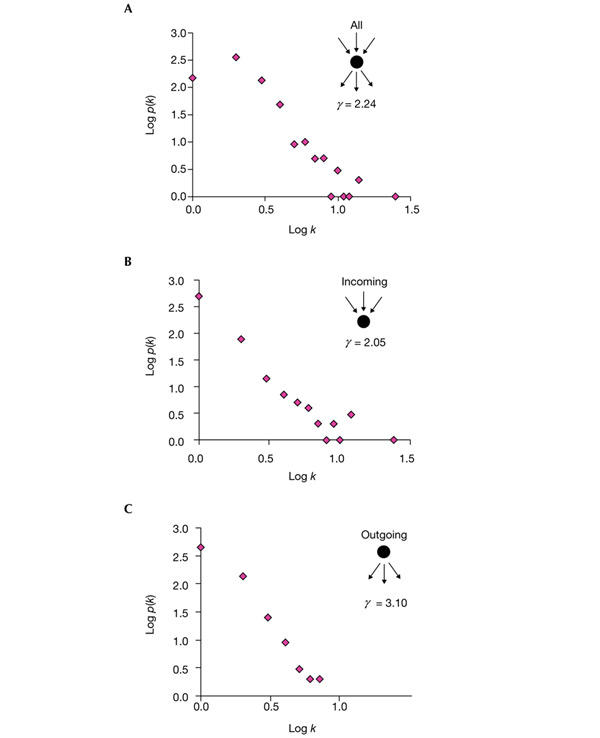
Figure 1.

Log–log plots of the number of compounds versus connectivity. (A) All connections in which the chemical compound is implicated (either as a substrate or as a product) are counted. (B) Only the incoming connections (with the compound as a product) are counted. (C) Only the outgoing connections (with the compound as a substrate) are counted. The exponents of the power law distributions are shown (γ). k, connectivity; p(k), number of compounds.
