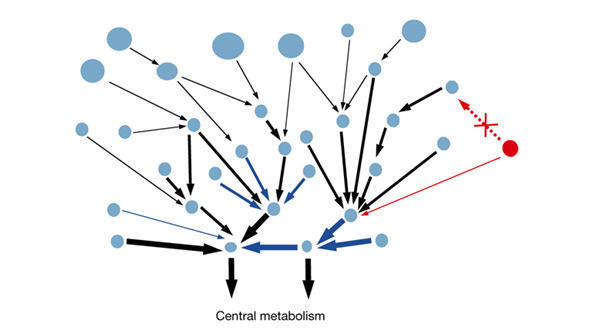
Figure 6.

Structure, properties and evolution of the biodegradation network. Chemical compounds are represented by circles, the areas of which are proportional to molecular weight. Reactions are represented by arrows, the widths of which are proportional to the antiquity of the catalysing enzyme. Blue arrows represent the ligase (Enzyme Commission 6.-.-.-) enzymatic activity that is often found close to the central metabolism. The red circle represents a new compound to be degraded. If two possibilities exist for attaching it to the network, it is preferentially connected to a node that is already highly connected (a hub).
