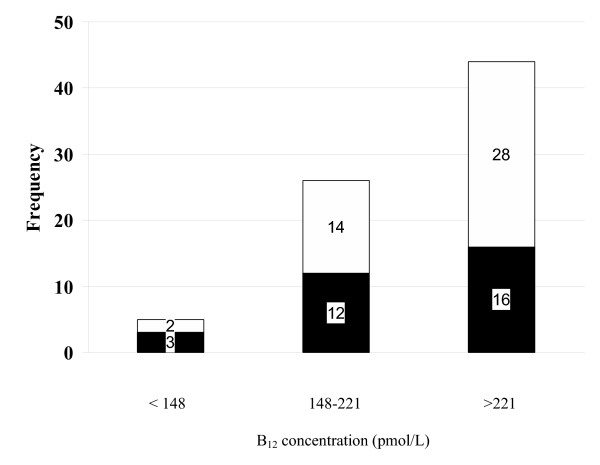
Figure 1.
Frequency of subjects with high or normal homocysteine levels as a function of serum B12 levels. Darkly shaded area represents the subjects with elevated homocysteine >13.3 μmol/L while lightly shaded area represents subjects with homocysteine ≤13.3 μmol/L for the three vitamin B12 intervals.

