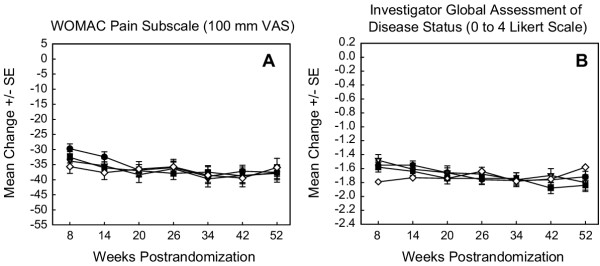
Figure 3.
Primary efficacy endpoints from during the active comparator controlled period (weeks 6 to 52). This is a comparison of etoricoxib 30, 60, and 90 mg with diclofenac 150 mg during the active comparator controlled extension periods. LS Mean Change from Baseline (Randomization) is shown. Modified intention-to-treat approach with last value carried forward was used. The number of patients at later visits (≥34 weeks) was small. Data should, therefore, be interpreted with caution. SE = Standard error.  = 30 mg etoricoxib;
  = 60 mg etoricoxib;
  = 90 mg etoricoxib;
  = 150 mg diclofenac.

