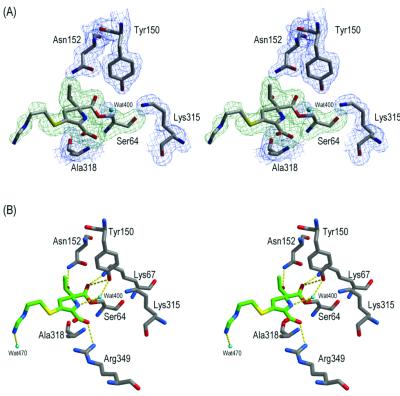
FIG. 2.
The active site for molecule 1 of the AmpC-imipenem complexed structure. (A) Stereoview of the electron density of the active site. The 2Fo-Fc electron density of the refined protein model is shown in blue, contoured at 1 σ, and the simulated annealing omit electron density of the refined ligand covalently bound to Ser64 is shown in green, contoured at 3.3 σ. Carbon atoms are colored gray, oxygen atoms are colored red, and nitrogen atoms are colored blue. Cyan spheres indicate water molecules. The figure was generated using SETOR software (4). (B) Stereoview of the interactions observed in the AmpC-imipenem complexed structure. Atoms are colored as described for panel A, except the carbon atoms of the ligand are colored green. Dashed yellow lines indicate hydrogen bonds. Figures 2B and 3 were generated using MidasPlus software (5).

