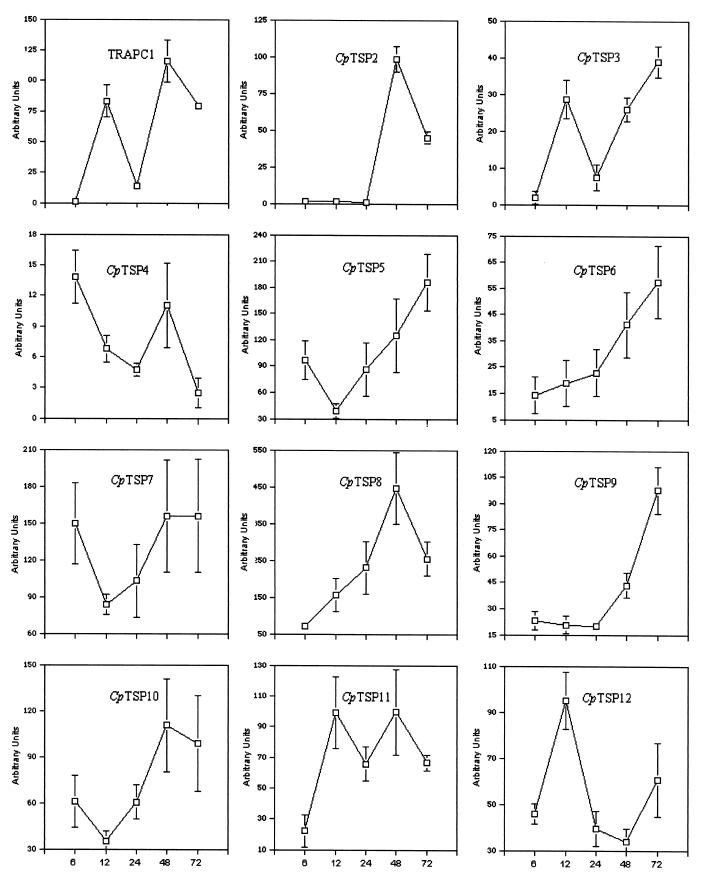
FIG. 6.
Expression profiles of C. parvum TRAPC1 and CpTSP2 to CpTSP12 during in vitro C. parvum development in HCT-8 cells. The data are expressed as the ratio of TRAPC1 and CpTSP2 thru CpTSP12 signal to C. parvum 18S rRNA signal present in each of the infected samples, as determined by using a phosphorimaging system. Error bars indicate the standard deviation of the mean of three independent experiments.

