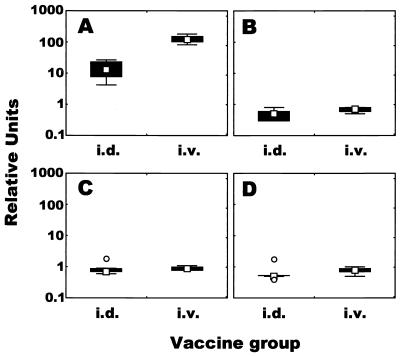
FIG. 4.
Profile of mycobacterium-specific cytokine responses induced by BCG vaccination. Spleen cells harvested 10 weeks after vaccination were stimulated in vitro with PPD of tuberculin antigen for 4 days. Total RNA was extracted, and IFN- γ (A), IL-12 (B), IL-10 (C), and TGF-β (D) mRNA levels were measured quantitatively by real-time RT-PCR. The results were expressed as relative units, as described in Materials and Methods. Shown are the medians (symbols in boxes), 25 to 75% response ranges (top and bottom lines of boxes), and nonoutlier minimums and maximums (whiskers). ○, values >1.5 box lengths.

